Cartographic Armageddon

Guess what? I’m back on that 40k Mapping thing again!

Behold Armageddon, one of the most fought over planets in the Imperium, with a Chaos invasion led by a Daemon Primarch, two Ork invasions led by Margaret Thatcher and the current general insanity caused by GW’s decision to move the plot forward under its belt.
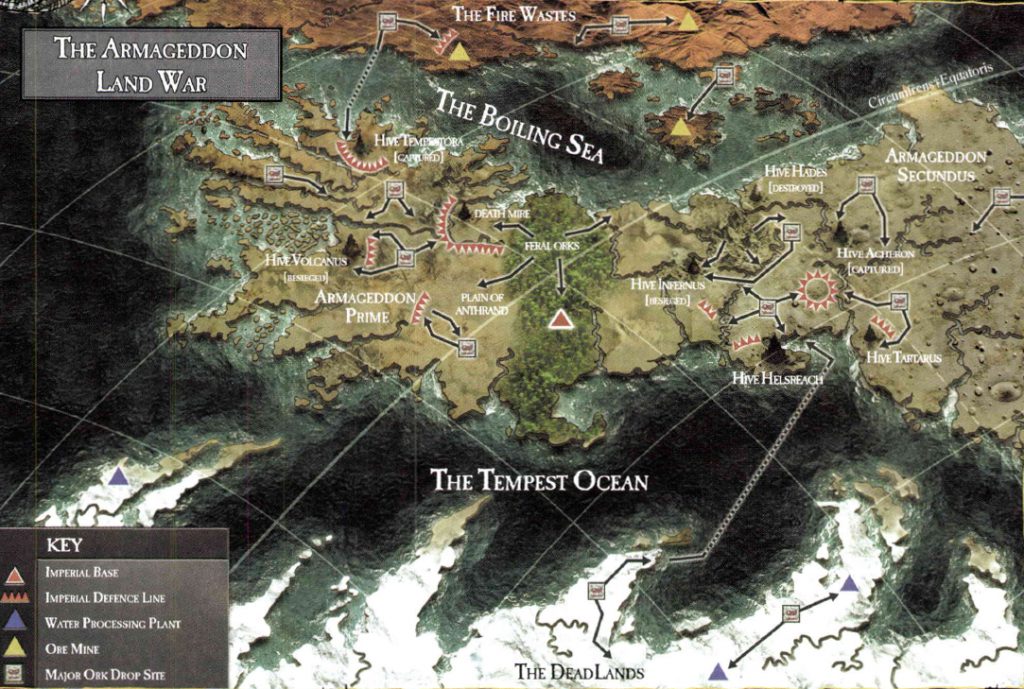
Armageddon tired of GW's Cartographic Ignorance
Armageddon tired of GW’s Cartographic Failures…

It’s a pretty nice map, however ever since its publication everyone at GW has completely forgotten how to read it.

Look at those lines. That’s right, the curved ones. They indicate that we’re not looking at a flat map, we’re looking at some kind of globular projection. Furthermore notice that the lines are slanted – that means that we’re not looking at the map from a  cardinal direction (north, south, east or west), but at an angle. And hey! Look in the upper right hand corner! One of the lines is marked as the equator! This tells us that north is to the upper left!
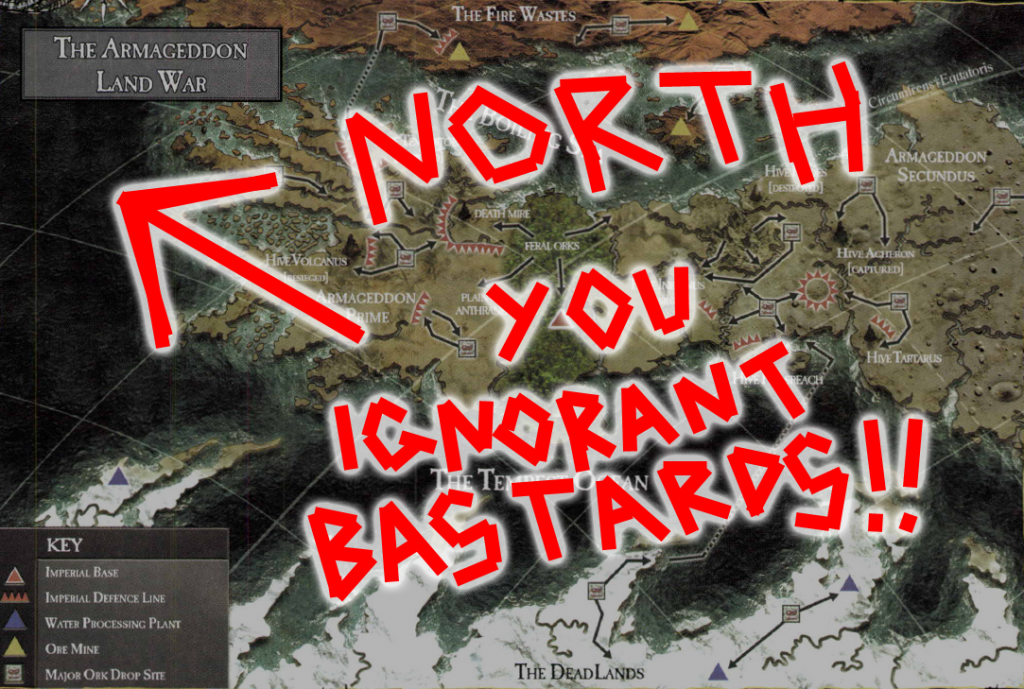
NORTH IS THAT WAY!!!

Unfortunately this is something that has escaped the notice of GW’s writers and artists who have consistently read it as a flattened, north oriented map, even publishing redraws of it with an upwards pointing compass rose slapped on top – most notably in the recent reprint of Gavin Thorpe’s Annihilation Squad (a damn good read actually, despite the compass directions being all screwy BECAUSE NO ONE AT GW CAN READ A GODDAMN MAP!).

Perhaps the silliest aspect of this are the planet’s famous equatorial jungles. If we look at the map above we can see that this name makes sense – they sit right across the planet’s equator. If we go by the later maps however they’re just randomly plonked running north to south, giving one the impression that whatever Ordo Cartographica scribe first charted the planet was hitting the amasec really hard.

So, what to do about this all this malarkey (apart from making a ranting blog post that no one else will ever care about)? Why, redraft the map of course!

Now, this is a bit easier said than done. The globular projection adds all kinds of distortions and while I am sure there is software out there that can correct them in the twinkling of a nurgling’s eye I don’t have access to them. So I decided to go old school and resort to paper and pencil.

Step one was to make the map grid a bit denser. I did this by tracing the existing grid in Inkscape and then running additional lines between each of them, splitting each of the existing map squares into four. Step two was to grab a piece of graph paper and sketch in the details of each square…
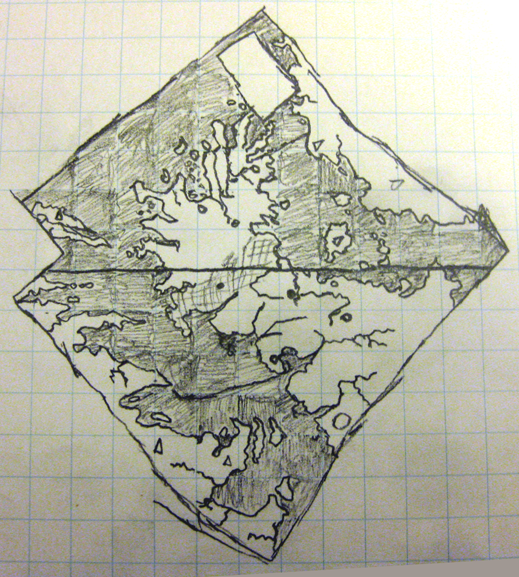
armageddon_map_corrected
So there we have it! That’s what a flattened out, north oriented Armageddon map really looks like! Armageddon Primus is actually north of Armageddon Secundus and the entire continent is stumpier than the angled view suggests

So, I now expect GW to start using this corrected version immediately! ;D

EDIT: Yes, it is rather strange that the continent to the west (the Dead Lands) is completely frozen over while the central continent (at the same latitudes) isn’t. There’s a clue to this in that the eastern continent (the Fire Wastes) appear to be barren desert. This would suggest that Armageddon has a pretty severe axial tilt combined with some rather weird orbital characteristics – which given its ancient history (no spoilers, but go read The Beast Arises…) is actually rather plausible.

On the Superiority of Cylindrical Equal-Area Projections

An ignorant American cartography professor and Apple-Maps developer was teaching a class on Gerardus Mercator, known DST advocate. “Before the class begins, you must get on your knees and worship Mercator and accept that he was the most highly-evolved cartographer the world has ever known, even greater than James Gall and Arno Peters!” At this moment, a brave, logical European Redditor who was a long-time contributor to sporcle.com and understood the superiority of cylindrical equal-area projections stood up and held up a globe. “What is the largest continent, pinhead?” The arrogant professor smirked quite Euro-centrically and smugly replied “Greenland, you stupid pleb! Can’t you see how much larger it is than Africa?” “Wrong,” said the student, and drew a perfect circle encompassing Greenland (which isn’t even green smh), “if Greenland is so big, how come there are more people outside this circle than inside?” The professor was visibly shaken, and dropped his chalk and copy of Nova et Aucta Orbis Terrae Descriptio ad Usum Navigantium Emendate Accommodata. He stormed out of the room crying those distorted conformal Mercator tears, his world collapsing around him. There is no doubt that at this point our professor, Alphons J. Van der Grinten, wished he had received a European education and become more than yet another distributor of lies in our flawed education system, and was kicking himself for never noticing that India has a greater north-south extent than Finland. The students applauded and all subscribed to /r/mapporn that day and accepted the Peirce Quincuncial projection as the coolest projection ever. There was a school-wide renouncement of outdated colonialist maps, and south-up maps (like the ones they definitely 100% use in Australia) were hung up across the northern hemisphere. God himself showed up and enforced geography as a mandatory subject in schools nationwide. The professor lost his tenure and was fired the next day. He committed suicide and his body was tossed into the Mariana trench. And that student’s name? Harry Beck, creator of the London Tube map.

(Not mine, but so good I had to share!)

Waylaid by Art

Cartographical exploits

Spent far too much time over the weekend doing the first bit of art (for a certain value of ‘art’) I’ve done in ages. A hand drawn map of London.

The idea (you can’t just draw something, you need to have an idea behind it for it to be real ‘art’) was to replicate half pages from the A-Z (the London street directory par exellence) by hand and then paste them all together. As each panel would be drawn without referencing the others the end result would be a fragmented, patchwork view of the city – kind of an exquisite corpse map – with roads, rivers and rail-lines fractured or just coming to dead stops. Close up it’s a mess, but zoomed out it’s still recognisably London.

(I suppose I could come up with some art-wank about it representing the tourist’s view of the city as a collection of disconnected enclaves surrounding tube stations, but that’s just a little too pretentious, even for me :))

The end result can be viewed here. Well, sort of the end result as after I scanned it I added another panel to the lower left. But you get the basic idea.

I was inspired to create the map by Londonist’s hand drawn map exhibition.  I’ve submitted it – guess we’ll see if they like it.

It’s actually a Dragon, just don’t tell the City that…

Map based ratings

It’s been stupidly hot for the last few days. Christmas day was the hottest since 1968 (41°), and Boxing day was the hottest December day since records began (44°). It’s a bit cooler today, but the humidity is brutal – so I’m not really in the mood to write about Christmas apart from that I had a very enjoyable breakfast of fruit, nuts and croissants at Rebecca and Dom’s, and a full Christmas lunch over at the Aunts’.

I figured instead I’d talk about the Great Gryffin of London.

Its eye is at Battersea Power Station, and its snout at Victoria station. One paw lies over Buckingham Palace, and the other the British Museum. Its heart is at Waterloo and its chest on the Victoria Embankment. Its wings spring from the Elephant and Castle and the Imperial War Museum, stretching to Clapham North and Herne Hill. Its feet lie at Bethnal Green and Stepney, and its knees at Shoreditch. Its rump sits neatly at Bricklayers Arms, and its tail stretches down the Thames to Greenland Dock.

See if you can spot it next time you’re in London:)

Close Bitnami banner
Bitnami